If the Orioles holding a 17-39 record and being 21 1/2 games out of first place didn’t depress you enough, below are 10 painful numbers entering the month of June:
3 – Number of winning months the Orioles have had since June 2016. Sure, the bottom fell out of a fun five-year run last September, but this club has been mediocre to bad for the better part of two years now.
3.73 — Runs scored per game to rank last in the American League. Only Miami has scored fewer per contest than an Orioles offense that was at least once feared despite its inconsistency over the years.
5.45 — Starter ERA, which ranks 28th in baseball. It’s better than last season’s 5.70 mark, but fewer runs are being scored across the majors so far in 2018, making this “improvement” even less impressive.
Minus-45 — Baltimore’s defensive runs saved total, which is last in the majors. Yes, 2014 feels like a very long time ago and the metrics match what your eyes are seeing in the field most nights.
93 — AL-high number of walks from the bullpen. The absences of Zach Britton and Darren O’Day have been tough, but not being able to throw strikes has led to a reliever ERA of 4.30, 21st in baseball.
.825 — Opposing on-base plus slugging percentage, highest in the majors. Manny Machado is the only Orioles hitter with a better OPS than what opponents are collectively doing against Baltimore pitchers.
7 — Number of wins in 30 road games. Washington has six road victories in the last week alone.
70 — How many more strikeouts the Orioles have than hits. This is a continuing trend around baseball, but being on pace to strike out 200 more times than your number of base hits is, well, something.
160 — Number of qualified major leaguers with a higher slugging percentage than Chris Davis’ .244, which ranks ahead of only Angels outfielder Kole Calhoun (.179). This is a decline of historic proportions.
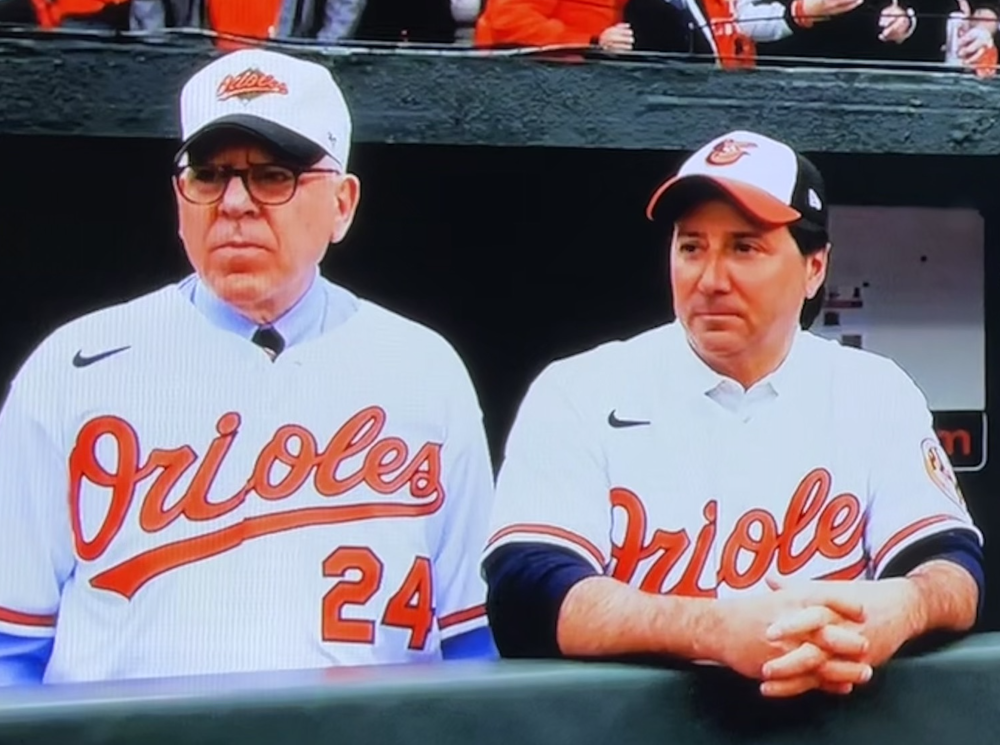
0 — Number of meaningful changes or statements from ownership signaling how disastrous this season has been. Is there anybody out there?


