


It’s no secret the Ravens endured a slew of serious injuries in 2017, especially before the regular season even began.
But where did their health rank compared to the other 31 NFL teams?
You’ll typically see the number of players on injured reserve cited in these discussions, but that alone doesn’t really paint the most insightful picture from team to team. How many on IR were starters compared to reserves or training camp bodies who had no realistic chance of even making the roster before getting hurt? How many on each team went to IR in September as opposed to the last week or two of the season? What about the teams that had more players pushing through injuries than those having cleaner injury reports on a weekly basis?
Football Outsiders uses a metric called adjusted games lost to attempt to quantify how much teams were stricken with injuries. Instead of simply counting the number of games lost with each player on IR, the metric weighs the projected role of each injured player (starter, key reserve, bench-warmer, etc.) and even accounts for those listed on weekly injury reports who ended up playing despite being less than 100 percent. In other words, the metric doesn’t treat the absence of six-time Pro Bowl guard Marshal Yanda or starting cornerback Jimmy Smith the same as developmental players Brandon Kublanow and Stephane Nembot being on IR and doesn’t completely ignore players battling through documented ailments.
The Ravens finished with the sixth-most adjusted games lost in 2017 with only Arizona, Houston, Miami, Chicago, and Washington having more than their 101.6. Ten of the 12 teams who qualified for the postseason — the exceptions being Kansas City and New Orleans — finished among the 14 teams with the fewest adjusted games lost, reinforcing just how critical health is to success. The Chiefs (80.0) and the Saints (95.9) were the only teams with more than 62.0 adjusted games lost to make the playoffs last season.
Before giving the Ravens a total pass for missing the playoffs for the third straight season, however, it’s fair to note Football Outsiders ranked their schedule as the second easiest in the NFL. It’s no secret the Ravens faced an unusual number of teams with poor quarterback situations, and they finished with the third-lowest strength of victory in the AFC with just one win against a team finishing with a winning record in 2017. That said, you wonder where Baltimore might have finished with even a middle-of-the-pack injury situation and such an advantageous schedule.
Football Outsiders also observed that the Ravens used the second-highest number of questionable designations on their weekly injury reports and finished with the second-highest percentage of questionable players to play, prompting the site to conclude they’re probably listing too many players as questionable that are much more certain to play that week. That likely skewed their adjusted games lost total a little bit on the high side.
Philadelphia winning the Super Bowl after losing several key players reminds us that it’s not impossible to overcome injuries with a deep roster and great coaching, but there is a breaking point, a reality reflected by the adjusted games lost totals and how they related to teams qualifying for the playoffs in 2017.
“Next man up” sounds great as a rallying cry or as a slogan on a t-shirt, but there are only so many injuries most teams can take. And when you acknowledge the number of early season-ending injuries sustained on an offense that didn’t look particularly impressive on paper to begin with and then consider the difficult-to-quantify impact from Joe Flacco’s preseason absence, Baltimore couldn’t persevere.
That’s not an excuse as the Ravens certainly have other deficiencies to address, but poor health was very much a part of their reality in 2017.
Below is a look at where the Ravens have ranked in Football Outsiders’ adjusted games lost in recent years:
2017 – 101.6 (sixth most in NFL)
2016 – 62.0 (11th fewest in NFL)
2015 – 96.1 (third most in NFL)
2014 – 52.6 (seventh fewest in NFL)
2013 – 49.8 (ninth fewest in NFL)
2012 – 57.4 (13th fewest in NFL)
2011 – 18.8 (fewest in NFL)
2010 – 50.9 (15th fewest in NFL)
2009 – 28.8 (seventh fewest in NFL)
2008 – 95.0 (third most in NFL)


 8
8


 88
88 8
8
Orioles waste strong start from Bassitt in 2-1 loss to Toronto to snap three-game winning streak
Chris Bassitt pitched six innings of one-run ball, but a Coby Mayo solo homer was the only offense Baltimore could muster.
Getting swept away by Orioles momentum
In a season with not a lot to get excited about, a three-game sweep of the first-place Tampa Bay Rays and better pitching has Luke Jones and Nestor ready to pick the Birds off the carpet and out of the cellar. And here come the Toronto Blue Jays.
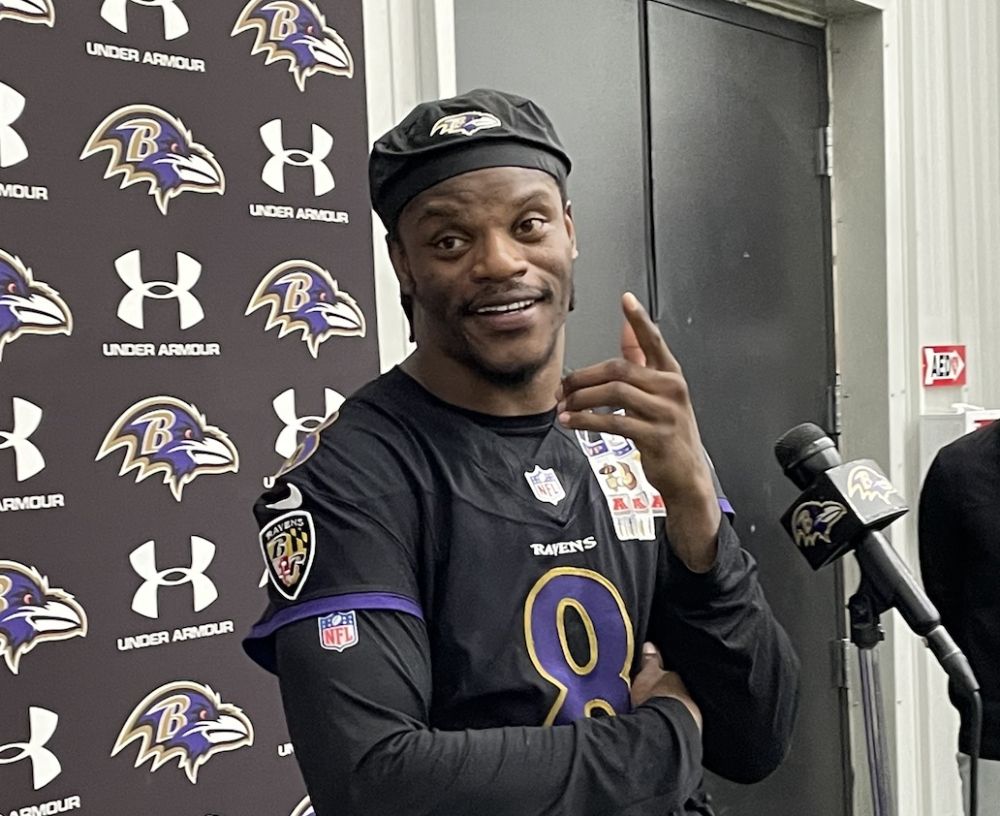
Twelve Ravens Thoughts following second open OTA workout
Lamar Jackson spoke to reporters for the first time since the end of the 2025 season and the firing of John Harbaugh.
888